See the pressure
Read directional volume flow alongside price so the move has context, not just a candle color.
Volume flow, made visible
TradeCanvas brings price, volume flow, and divergence into one focused workspace for sharper decisions.
No card required to begin.
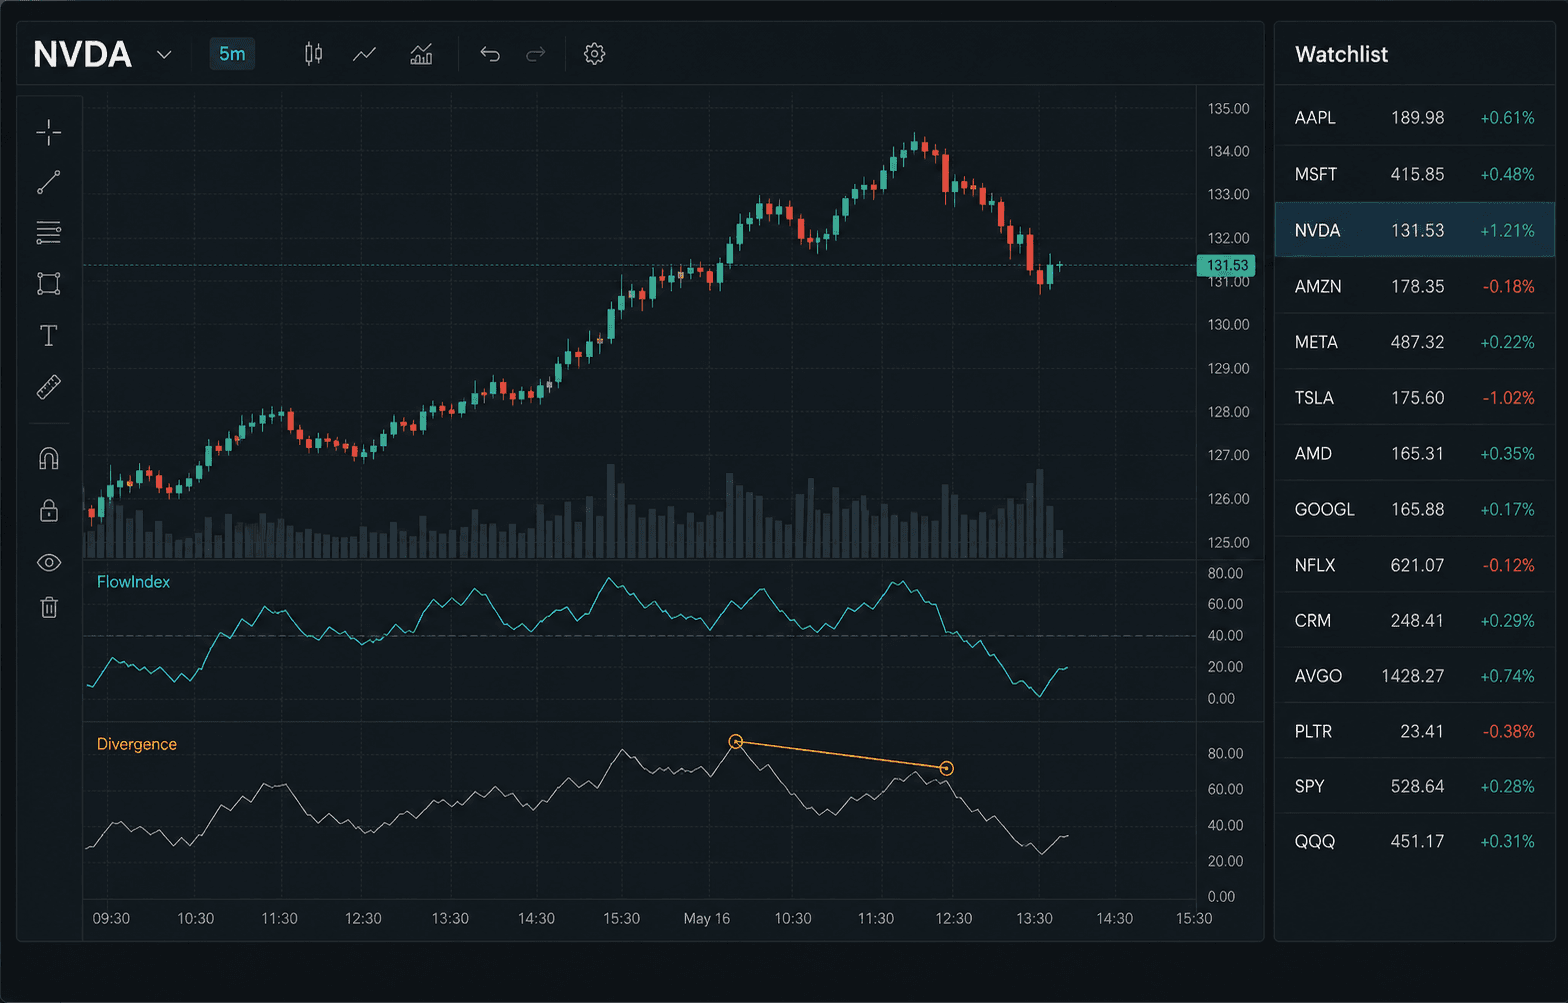
A clearer read
Keep the chart familiar. Add the information that tells you when price and participation stop agreeing.
Read directional volume flow alongside price so the move has context, not just a candle color.
Spot divergence as it develops with a dedicated FlowIndex view built for fast pattern recognition.
Compare multiple timeframes in one workspace without losing the signal you were following.
Your next read
Start with the market you already watch.
Layer FlowIndex onto the price action.
Use context to plan your next move.
Make the chart useful